Solving a Probability Problem on Quora
Introduction
On Quora, I find this interesting problem: “If you choose two random numbers, ‘a’ and ‘b’, from the interval [0, 1], and then another two, ‘c’ and ’d' from the same interval, what is the probability that the intervals of [a, b] and [c, d] overlap?” Alon Amit provided a nice solution to this problem—see details in https://qr.ae/prPSM6
Alon’s solution inspires me to do the following things:
- generalizing the the original problem
- giving a solution to the generalized problem
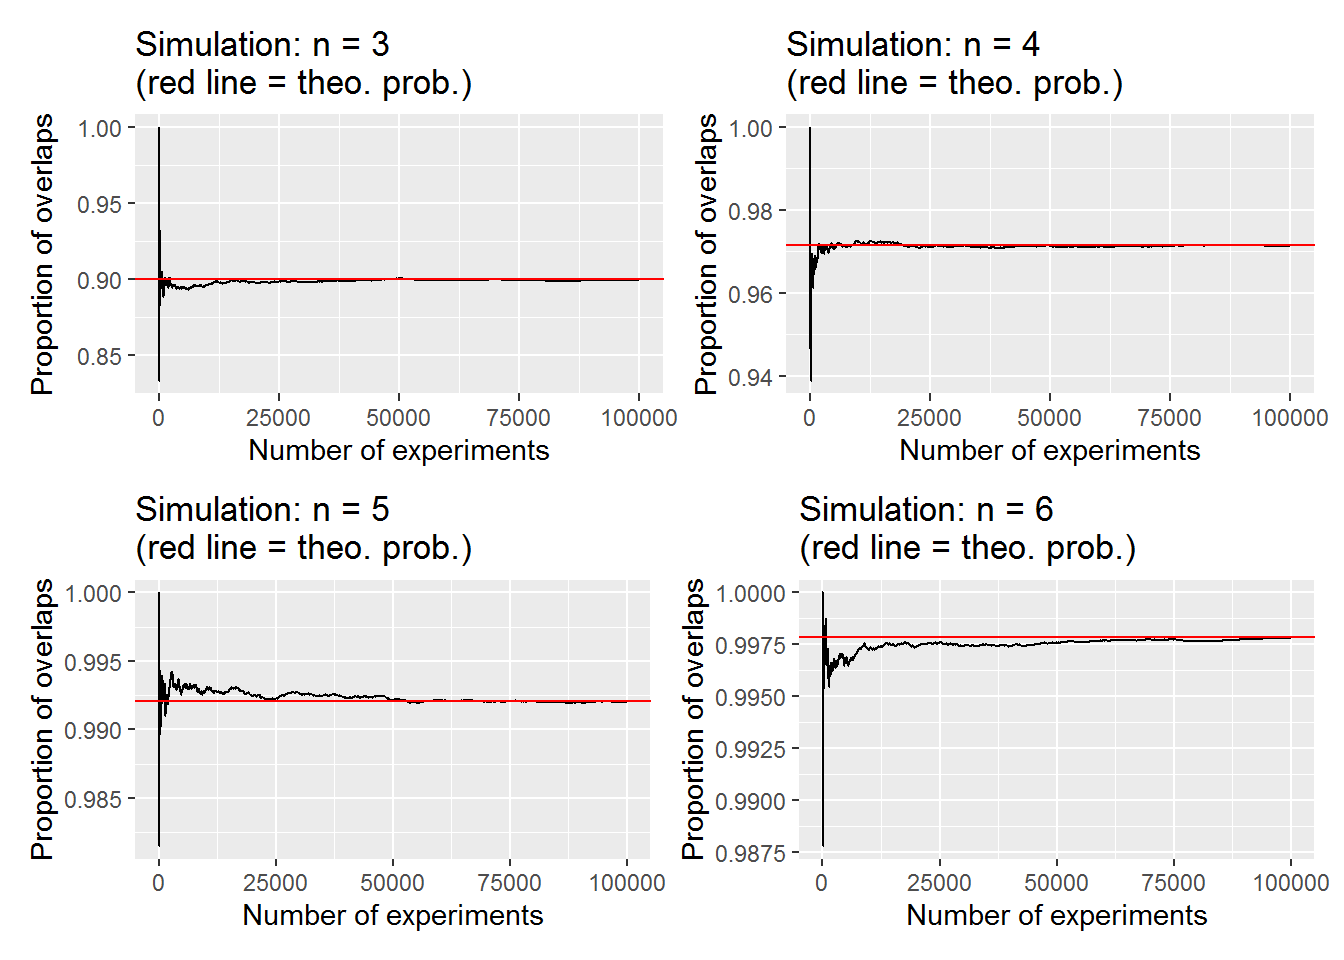
- using simulation to check my solution
Generalized problem and solution
Firstly, I want to generalize the original problem as: “There are two persons. Each of them chooses $n$ ($\ge 2$) random numbers from the interval [0, 1]. Let [a, b] and [c, d] denote the intervals resulted from their $n$ random numbers, respectively. What is the probability that the two intervals overlap?” Note if $n=2$ then this is exactly the same problem as the original one on Quora.
Secondly, the solution. Let $p(n)$ denotes the probability—we put $n$ in the parentheses to emphasize that the probability is determined by $n$. Inspired by Alon’s solution to the original problem, my solution to the generalized one is
$$ p(n) = 1 - \frac{2n!n!}{(2n)!}, $$
where '$!$' is for 'factorial'. For example,$$ p(2) = 1 - \frac{2\times 2!\times 2!}{4!}=1 - \frac{8}{24}=\frac{2}{3}, $$
which is the same answer as given by Alon.R code
library(ggplot2)
library(patchwork)

# a helper function -------------------------------------------------------
my_range <- function(x)
{max(x) - min(x)
}

# simulation --------------------------------------------------------------
simu_overlap <- function(n = 2, N = 100000)
{ m <- 2 * n
  the_prob <- 1 - (2 * factorial(n)^2) / (factorial(m))
  data <- matrix(runif(m * N), ncol = m, byrow = TRUE)
  range_1 <- apply(data[, 1:n], 1, my_range)
  range_2 <- apply(data[, (n+1):m], 1, my_range)
  whole_range <- apply(data, 1, my_range)
  chk <- (whole_range < (range_1 + range_2))
  y <- cumsum(chk) / (1:N)
  df <- data.frame(x = 1:N,
                   pn = y)
  p <-
    ggplot(df, aes(x = x, y = pn)) +
    geom_line() +
    geom_abline(slope = 0, intercept = the_prob, col = 'red') +
    labs(x = 'Number of experiments',
         y = 'Proportion of overlaps',
         title = sprintf("Simulation: n = %d\n(red line = theo. prob.)", n))
  return(list(list('simu_prob' = y[N], 'theoretical_prob' = the_prob),
              p))
}

re <- lapply(3:6, function(x) simu_overlap(x, N = 100000))

re_list <- list('n=3' = re[[1]][[1]],
                'n=4' = re[[2]][[1]],
                'n=5' = re[[3]][[1]],
                'n=6' = re[[4]][[1]])
the_plot <- (re[[1]][[2]] | re[[2]][[2]]) / (re[[3]][[2]] | re[[4]][[2]])
print(re_list)
## $`n=3`
## $`n=3`$simu_prob
## [1] 0.8995
##
## $`n=3`$theoretical_prob
## [1] 0.9
##
##
## $`n=4`
## $`n=4`$simu_prob
## [1] 0.9713
##
## $`n=4`$theoretical_prob
## [1] 0.9714286
##
##
## $`n=5`
## $`n=5`$simu_prob
## [1] 0.99199
##
## $`n=5`$theoretical_prob
## [1] 0.9920635
##
##
## $`n=6`
## $`n=6`$simu_prob
## [1] 0.9978
##
## $`n=6`$theoretical_prob
## [1] 0.9978355
the_plot
Lingyun Zhang (张凌云)
Design Analyst
I have research interests in Statistics, applied probability and computation.