Having Fun With Large Numbers
Introduction
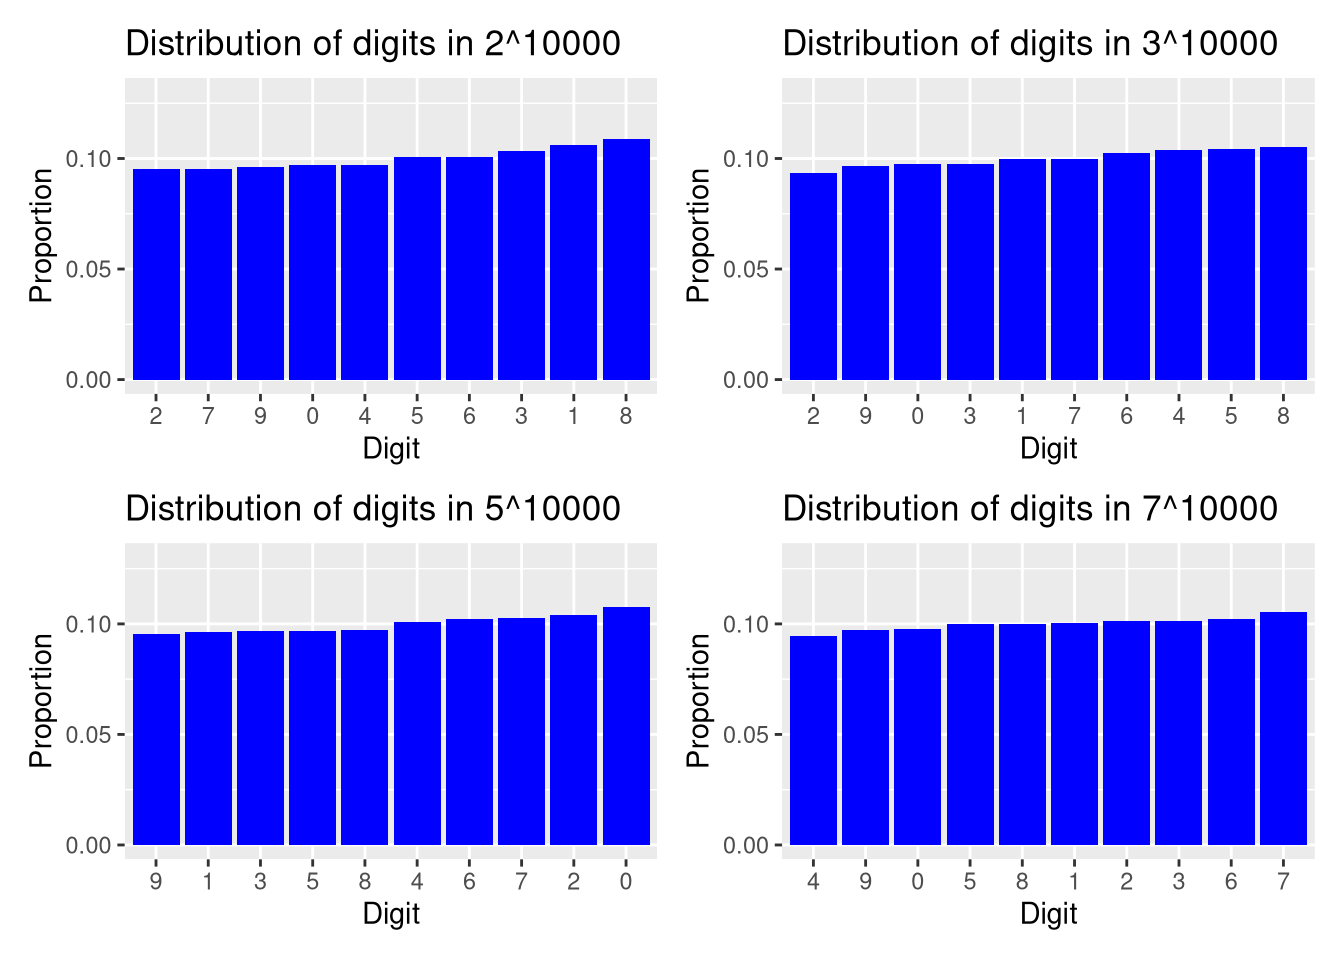
By a large number, I mean something like $a^N$, e.g. $2^{10,000}$. It’s easy to determine that the number of digits in $a^N$ is given by $ \hbox{floor}(N \log_{10}(a))+1. $ In this note, I will plot the distribution of the digits in $a^N$. This serves as good practice for me to re-familiarize myself with using the R function Rmpfr::mpfr.
R code
library(tidyverse)
library(patchwork)


# functions ---------------------------------------------------------------
## data
prep_data <- function(a = 2, N = 10000)
{the_precBits <- ceiling(log2(10) * N)
 L_nbr <- Rmpfr::mpfr(a, precBits = the_precBits) ^ N
 string <- str_replace(Rmpfr::formatMpfr(L_nbr, digits = 0), "[.].+", "")
 string_v <- strsplit(string, split = "")[[1]]
 df <-
   data.frame(s = string_v, stringsAsFactors = FALSE) %>%
   count(s, name = 'freq') %>%
   mutate(prop = freq / sum(freq))
 return(df)
}

## make plot
my_plot <- function(a_df, a, N)
{p <-
  a_df %>%
  ggplot(aes(x = fct_reorder(s, prop), weight = prop)) +
  geom_bar(fill = 'blue') +
  scale_y_continuous(limits = c(0, 0.13)) +
  labs(x = "Digit", y = "Proportion",
       title = glue::glue("Distribution of digits in {a}^{N}"))
 p
}

## integrate
my_integrate <- function(a = 2, N = 10000)
{df <- prep_data(a = a, N = N)
 p <- my_plot(df, a = a, N = N)
}


# experiments -------------------------------------------------------------
p_1 <- my_integrate(a = 2, N = 10000)
p_2 <- my_integrate(a = 3, N = 10000)
p_3 <- my_integrate(a = 5, N = 10000)
p_4 <- my_integrate(a = 7, N = 10000)

(p_1 | p_2) / (p_3 | p_4)
Lingyun Zhang (张凌云)
Design Analyst
I have research interests in Statistics, applied probability and computation.